The easiest way to detect and fix memory leaks using Android Studio Profiler Tool and WeakReference ❤

Hello Android Devs,
I hope you are doing great, going memory leak-free ;).
No problem if you find your memory leaks after reading this article because this is one very simple and easy way to find memory leaks. Even though there are other ways to find leaks as well for example (LeakCanary) but let’s just focus on android studio one.
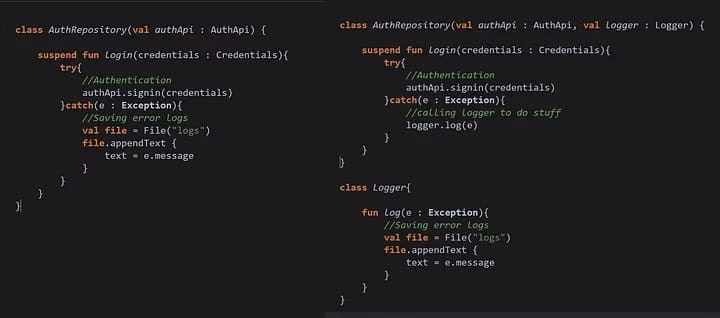
Let’s jump into some practical code examples and see if you can spot anything wrong.
Yes !! you are right for example I start activity B from Activity A and then in Activity B I initialize this singleton after some time I quit this activity because I no longer needed this activity. But my singleton has a reference of activity B but activity B is no longer available in the stack so it leads to a memory leak. if we open the android studio profiler (screenshots attached below) we can see a yellow badge showing the dangling pointer of Activity B.
This is where the garbage collector gets confused because of the dangling pointer issue and this state is called a memory leak.
How to fix this issue?
These issues are created because of strong references. Every object created with the new keyword in Java or Kotlin is by default a strong reference to the given scope.
When the compiler wants to clear that B reference which is no longer pointing to its original space because it was in strong reference GC fails to do so.
So to avoid this issue by helping GC we use WeakReference wrapper class which gives instructions to the GC collector that it needs to clear following variable because it has a weak reference with its container so whenever its original scope is no longer available in memory it is flagged to be collected.
There few other types of reference for example Soft Reference:: It’s more or less the same as the weak reference. But you can say that it holds the object a bit more strongly than the weak reference from garbage collection.
Another less popular Phantom Reference which is mostly used for debugging purposes it’s quite different than either SoftReference or WeakReference. Its grip on its object is so tenuous that you can’t even retrieve the object — its get() method always returns null. The only use for such a reference is keeping track of when it gets enqueued into a ReferenceQueue, as at that point you know the object to which it pointed is dead
Sticking to a topic our best friend to avoid leaks is WeakRefrence. Lookt at following example where I fixed this issue
Enough theory and code, let’s jump into the process of debugging leaks using android studio.


You can see the magic of weak reference to fix this leak. I’ve attached my code in this article if you want to experience this by yourself which I highly recommend you. Clone my repository and start writing memory leaks free apps 🙂
if you like this article do clap and subscribe for more important topics.
Bye 🙂
Share this article

Written by : admin
Latest Articles
June 21, 2024

June 11, 2024

June 10, 2024

May 31, 2024
May 27, 2024
May 10, 2024

February 1, 2024

December 28, 2023

December 26, 2023

December 18, 2023

December 15, 2023

September 26, 2023

September 21, 2023

September 19, 2023

September 19, 2023

September 12, 2023

September 5, 2023

August 29, 2023

March 31, 2023
March 20, 2023

March 13, 2023

March 13, 2023
March 13, 2023
March 13, 2023
March 13, 2023